Multiple Choice
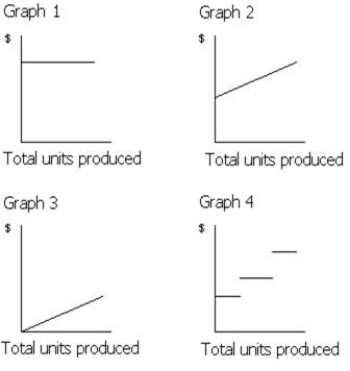
-Which of the graphs in Figure 21-1 illustrates the behavior of a total fixed cost?
A) Graph 2
B) Graph 3
C) Graph 4
D) Graph 1
Correct Answer:

Verified
Correct Answer:
Verified
Related Questions
Q45: If variable costs per unit increased because
Q46: Flying Cloud Co. has the following operating
Q47: Which of the following conditions would cause
Q48: If a business sells four products, it
Q49: The following is a list of various
Q51: Variable costs are costs that remain constant
Q52: If yearly insurance premiums are increased, this
Q53: For the past year, Iris Company had
Q54: With the aid of computer software, managers
Q55: Cost behavior refers to the methods used