menu-iconExamlexExamLexServices

Discover

Ask a Question
  1. All Topics
  2. Topic
    Business
  3. Study Set
    Accounting Study Set 4
  4. Exam
    Exam 21: Cost-Volume-Profit Analysis
  5. Question
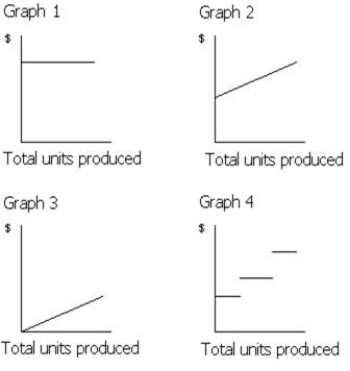
    -Which of the Graphs in Figure 21-1 Illustrates the Nature
Solved

-Which of the Graphs in Figure 21-1 Illustrates the Nature

Question 41

Question 41

Multiple Choice

  -Which of the graphs in Figure 21-1 illustrates the nature of a mixed cost? A)  Graph 2 B)  Graph 3 C)  Graph 4 D)  Graph 1
-Which of the graphs in Figure 21-1 illustrates the nature of a mixed cost?


A) Graph 2
B) Graph 3
C) Graph 4
D) Graph 1

Correct Answer:

verifed

Verified

Unlock this answer now
Get Access to more Verified Answers free of charge

Related Questions

Q36: The relevant activity base for a cost

Q37: If a business sells two products, it

Q38: Bryce Co. sales are $914,000, variable costs

Q39: Match the following terms (a-e) with their

Q40: If fixed costs are $450,000, the unit

Q42: Which of the following conditions would cause

Q43: Jacob Inc. has fixed costs of $240,000,

Q44: Consider the following information:?Variable cost per unit

Q45: If variable costs per unit increased because

Q46: Flying Cloud Co. has the following operating

Examlex

ExamLex

About UsContact UsPerks CenterHomeschoolingTest Prep

Work With Us

Campus RepresentativeInfluencers

Links

FaqPricingChrome Extension

Download The App

Get App StoreGet Google Play

Policies

Privacy PolicyTerms of ServiceHonor CodeCommunity Guidelines

Scan To Download

qr-code

Copyright © (2025) ExamLex LLC.

Privacy PolicyTerms Of ServiceHonor CodeCommunity Guidelines