Essay
The cost graphs below show various types of cost behaviors.For each of the following costs, identify the cost graph that best describes its cost behavior as the number of units produced and sold increases: 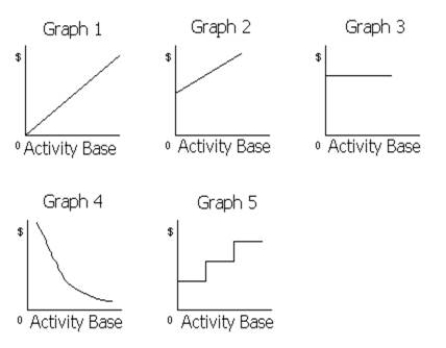 (a)Sales commissions of $6,000 plus $0.05 for each item sold
(b)Rent on warehouse of $12,000 per month
(c)Insurance costs of $2,500 per month
(d)Per-unit cost of direct labor
(e)Total salaries of quality control supervisors
(One supervisor must be added for each additional work shift.)
(f)Total employer pension costs of $0.35 per direct labor hour
(g)Per-unit straight-line depreciation costs
(h)Per-unit cost of direct materials
(i)Total direct materials cost
(j)Electricity costs of $5,000 per month plus $0.0004 per kilowatt-hour
(k)Per-unit cost of plant superintendent's salary
(l)Salary of the night-time security guard of $3,800 per month
(m)Repairs and maintenance costs of $3,000 for each 2,000 hours of factory machine usage
(n)Total direct labor cost
(o)Straight-line depreciation on factory equipment
Correct Answer:

Verified
Correct Answer:
Verified
Q191: Which of the following statements is true
Q192: Absorption costing is required for financial reporting
Q193: Tom Company reports the following data:Sales$600,000Variable costs400,000Fixed
Q194: In a cost-volume-profit chart, the<br>A) total cost
Q195: If fixed costs are $650,000 and the
Q197: The three most common cost behavior classifications
Q198: If fixed costs are $250,000, the unit
Q199: The point where the profit line intersects
Q200: If fixed costs increased and variable costs
Q201: A firm operated at 90% of capacity