Essay
The quarterly sales of a company (in millions of dollars) over the past three years are given in the following table. 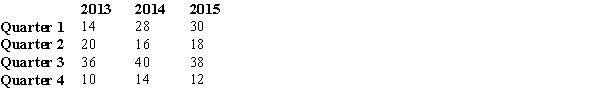
a.
Compute the four seasonal indexes.
b.
The trend for these data is Trend = 20.82 + .336t (t represents time, where t = 1 for Quarter 1 of 2013 and t = 12 for Quarter 4 of 2015). Forecast sales for the first quarter of 2016 using the trend only.
c.
Forecast sales for the first quarter of 2016 using the trend and seasonal indexes and write your answer below.
Correct Answer:

Verified

b.
$25....View Answer
Unlock this answer now
Get Access to more Verified Answers free of charge
Correct Answer:
Verified
b.
$25....
View Answer
Unlock this answer now
Get Access to more Verified Answers free of charge
Q4: The time series pattern showing an alternating
Q5: Below you are given the first four
Q6: A parameter of the exponential smoothing model
Q7: A seasonal pattern<br>A) exists if the time
Q8: What is the forecast for July based
Q10: The objective of smoothing methods is to
Q11: In the linear trend equation, T<sub>t</sub> =
Q12: Below you are given the first five
Q13: Below you are given the first five
Q14: Actual sales for January through April are