Multiple Choice
Which graph shows data that are more suitable for regression analysis?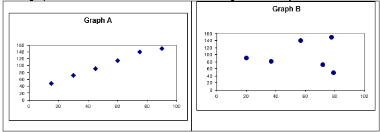
A) Graph A
B) Graph B
C) Neither Graph A nor Graph B
D) Cannot be determined
Correct Answer:

Verified
Correct Answer:
Verified
Related Questions
Q83: The high-low method is a specific application
Q118: Learning curves lead to greater productivity over
Q119: A regression of total selling expenses against
Q120: Reviewing cost behaviour patterns over time from
Q121: Three different divisions of a footwear
Q123: All of the following are assumptions for
Q124: A firm's production is expected to show
Q125: If we are determining costs for a
Q126: Managers analyze production activities and assign costs
Q127: A new product's learning curve rate can