Multiple Choice
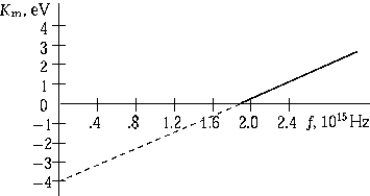 The graph shows the maximum kinetic energy of electrons emitted by a photosensitive surface as a function of the frequency of the incident radiation. The slope of this curve represents
A) the intensity of the incident radiation.
B) the maximum kinetic energy.
C) the threshold frequency.
D) Planck's constant.
E) the stopping potential.
Correct Answer:

Verified
Correct Answer:
Verified
Q11: An electron in the hydrogen atom (ground-state
Q53: The wavelength of the photon emitted when
Q72: The quantum theory suggests that the stable
Q75: The electron configuration of nitrogen Z =
Q77: In the Bohr model of the atom<br>A)
Q82: The first Bohr radius, a<sub>0</sub>, is 0.0529
Q84: An electron in a hydrogen atom jumps
Q85: What is the ratio of the radius
Q129: When a surface is illuminated with light
Q131: In a Compton scattering experiment,an 8.00-MeV incident