Multiple Choice
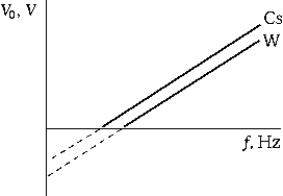 The graph shows the stopping potential for photoelectrons as a function of the frequency of the incident light for two different metals Cs and W) . Which of the following statements is true?
A) Because the intercepts are different, Planck's constant is not constant.
B) For a given frequency of incident light, the photoelectrons from W are more energetic than those from Cs.
C) The maximum kinetic energy of the photoelectrons increases as the frequency of the incident light increases.
D) The stopping potentials for all metals are the same.
E) The threshold frequency for Cs is greater than that for W.
Correct Answer:

Verified
Correct Answer:
Verified
Q19: Which of the following statements is
Q19: Albert Einstein was awarded the Nobel Prize
Q26: The p state of an electronic configuration
Q64: The number of electrons in the M
Q67: The momentum of a 20-MeV electron is
Q72: Which of the following statements about Maxwell's
Q73: The speed of the escaping photoelectrons<br>A) increases
Q74: Calculate the wavelength of light of energy
Q101: An alpha particle (mass = 4 amu)is
Q137: Electrons do not exhibit wave properties as