Multiple Choice
The curve shows the position of an object with time. The object moves with a constant speed, v. 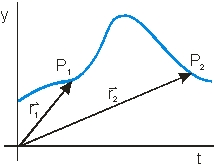 Which of the vector diagrams below best represent the change in velocity vector from P1 to P2?
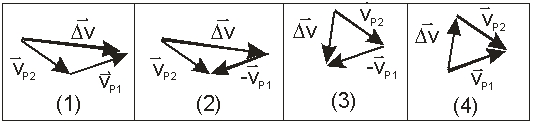
A) 1)
B) 2)
C) 3)
D) 4)
E) None of these is correct.
Correct Answer:

Verified
Correct Answer:
Verified
Q45: A projectile was fired at 35º above
Q58: A naughty squirrel jumps from a tree
Q69: A vector of magnitude 5 points in
Q70: The position vector of an object is
Q71: Vectors <img src="https://d2lvgg3v3hfg70.cloudfront.net/TB7291/.jpg" alt="Vectors and
Q72: A projectile is fired at an angle
Q73: The figure represents the parabolic trajectory
Q76: If air resistance is neglected and the
Q77: Vectors <img src="https://d2lvgg3v3hfg70.cloudfront.net/TB7291/.jpg" alt="Vectors and
Q78: The components of four vectors are as