Multiple Choice
The graph shows how the position of a particle depends on time. 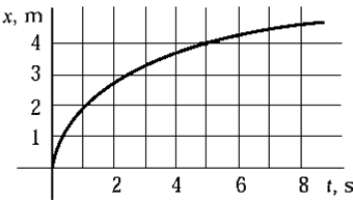 Which choice is closest to the average speed of the particle in the time interval between 0 and 6 s?
A) 0.40 m/s
B) 0.67 m/s
C) 0.75 m/s
D) 1.50 m/s
E) 2.22 m/s
Correct Answer:

Verified
Correct Answer:
Verified
Related Questions
Q16: An object is dropped from rest near
Q42: A car accelerates uniformly from a velocity
Q43: A graph showing motion of an object
Q44: Which of the v versus t graphs
Q45: A distracted driver going along a parkway
Q46: Which graph of v versus t best
Q48: The graph is a plot of velocity
Q49: An object is thrown upward with a
Q51: A particle moves from x<sub>0</sub> = 30
Q52: On a graph that shows position on