Multiple Choice
The motion diagram shows motion an ant moving to the right along a straight line as it is recorded every 1.0 s, starting at point at x = 0.0 cm. Assuming the ant starts from rest, which graph shows ant's velocity as a function of time? 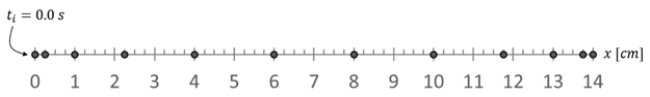
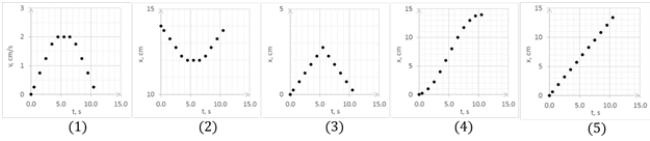
A) 1)
B) 2)
C) 3)
D) 4)
E) 5)
Correct Answer:

Verified
Correct Answer:
Verified
Related Questions
Q3: Two baseballs are thrown vertically up from
Q4: Which graph of v versus t best
Q5: In which graph is the particle the
Q7: Which of the following statements is correct?<br>A)
Q9: The distance traveled by a car in
Q10: On a graph that shows position on
Q13: A vehicle is traveling in the +x
Q22: An object is moving in a straight
Q60: A particle moves from x<sub>1</sub> = -50
Q78: A projectile is fired vertically upward with