Multiple Choice
The graph represents the position of a particle along the x axis as a function of time. 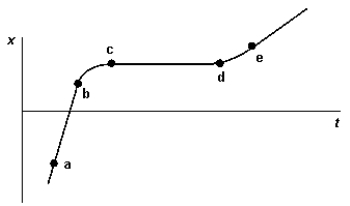 The interval in which the velocity of this particle is negative is
A) a-b
B) b-c
C) d-e
D) c-d
E) None of these are correct.
Correct Answer:

Verified
Correct Answer:
Verified
Related Questions
Q49: A baseball is thrown vertically up to
Q70: The graph represents the position of a
Q71: If we assume that a spaceship could
Q72: Which of the graphs shows motion of
Q73: A Lamborghini sports car can accelerate from
Q74: On a graph that shows velocity on
Q76: A sandbag is released from a rising
Q77: In which graph of v versus t
Q78: The distance traveled by a car in
Q79: On a graph that shows acceleration on