Multiple Choice
The graph below shows position as a function of time for a swimmer competing in a 100-m race swimming twice the length of a 50.0 m pool) . Which of the following statements regarding the motion is incorrect? 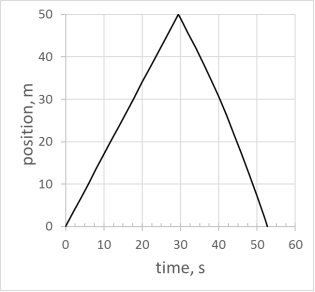
A) The average speed of the swimmer is 1.90 m/s.
B) The average velocity of the swimmer is 1.90 m/s,
C) The average velocity of the swimmer is 0.0 m/s
D) When swimming the second part of the 100-m race, the swimmer is moving with negative velocity.
E) Swimmer's average acceleration during the second part of the 100-m race is negative.
Correct Answer:

Verified
Correct Answer:
Verified
Q19: A racecar starts from rest and accelerates
Q54: A particle decelerates uniformly from a speed
Q59: A common statistic in car tests is
Q60: The motion diagram shows motion an ant
Q61: If we assume that a spaceship could
Q62: In which graph is the particle the
Q62: A hammer and feather are dropped from
Q63: You drive for 30 min for 30
Q68: An object moves along the horizontal axis
Q69: Which graph of v versus t best