Essay
The scatter plot and residual plot shown below is from a regression analysis of Prehistoric Native American projectile points. The widths of the projectiles were regressed on the length of the projectile points. 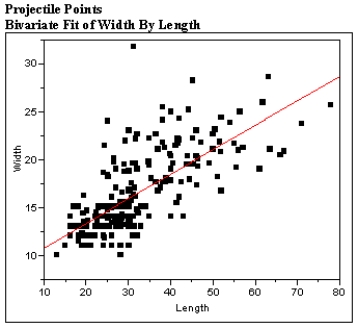
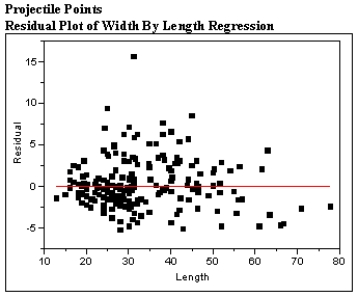 Using these plots categorize each of the Basic Assumptions of the simple linear regression model as one of the following:
a) Not checkable
b) Checked and met
c) Checked and not met
For all assumptions checked, explain what aspect of the graphs led you to your conclusion that the assumption was met or not met.
Correct Answer:

Verified
Checking the assumptions:
• The distrib...View Answer
Unlock this answer now
Get Access to more Verified Answers free of charge
Correct Answer:
Verified
• The distrib...
View Answer
Unlock this answer now
Get Access to more Verified Answers free of charge
Q18: The standard deviation of the statistic b,
Q19: In the simple linear regression model, the
Q20: The Iowa Tests of Educational Development are
Q21: The estimated standard deviation, s<sub>e</sub>, has n
Q22: When the four basic assumptions for a
Q24: In the simple linear regression model, the
Q25: The estimated mean value of y is
Q26: The computer output given below shows a
Q27: The general form of additive probabilistic model
Q28: A random sample of steelhead trout was