Essay
One of the problems when estimating the size of animal populations from aerial surveys is that animals may bunch together, making it difficult to distinguish and count them accurately. For example, a horse standing alone is easy to spot; if seven horses huddled close together some may be missed, resulting in an undercount. The relative frequency of undercounts is typically reported as a percent. For example, if there are 10 horses in a group, a person in the plane may typically count fewer than 10 horses 20% of the time. In a recent study, the percent of sightings that resulted in an undercount was related to the size of the "group" of horses and donkeys; the following data were gathered: 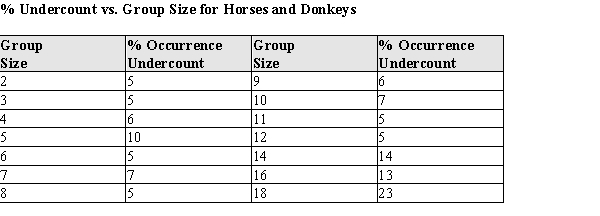 After fitting a straight line model,
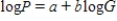
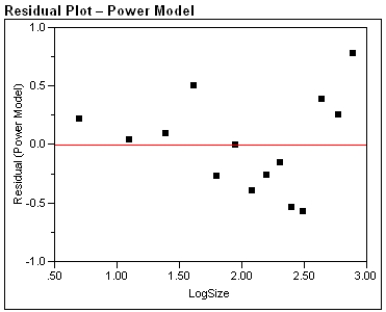
  , significant curvature was detected in the residual plot, and two nonlinear models were chosen for further analysis, the exponential and the power models. The computer output for these models is given below, and the residual plots follow.
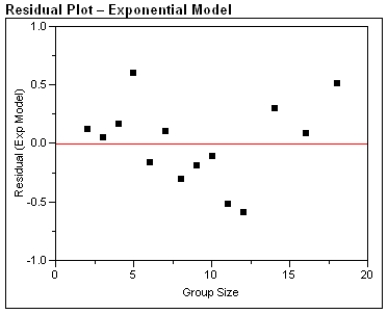
 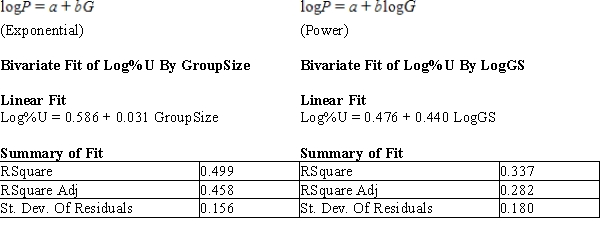 Residual Plots
a) For the exponential model, calculate the predicted log (%undercount) for a group size = 10.
b) Use your calculations from part (a) to predict the %undercount for a group size = 10.
c) Generally speaking, which of the two models, power or exponential, is better at predicting the log (Percent Undercount)? Provide statistical justification for your choice.
Correct Answer:

Verified
Correct Answer:
Verified
Q1: The value of the residual plus <img
Q3: The correlation coefficient between the consumption of
Q4: If |r| = 1, the standard deviation
Q5: One of the properties of Pearson's r
Q6: What is it that the Pearson correlation
Q7: The slope of the least squares line
Q8: The use of small aircraft with human
Q9: The Des Moines Register recently reported the
Q10: A cause-and-effect relationship between two variables is
Q11: The breeding success of birds that nest