Essay
The data in the table below are from observations taken on Roman coins dating from the first three centuries AD. Historians believe that different mints might reveal themselves in different trace element profiles in the coins; these coins are known to have been minted in Rome. The technique of Atomic Absorption Spectrometry was used to estimate the % by weight of various elements in these coins; the % by weight that is gold is presented here. 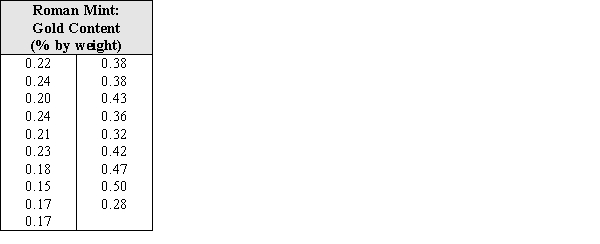 (a) Calculate these numerical summaries:
The mean _______________
The standard deviation _______________
The median _______________
The interquartile range _______________
(b) Construct a skeletal box plot for these data.
(c) Judging from the data and your responses in parts (a) and (b), would you say this distribution is skewed or approximately symmetric? Justify your response using appropriate statistical terminology.
Correct Answer:

Verified
a) mean = .292 standard deviation = .111...View Answer
Unlock this answer now
Get Access to more Verified Answers free of charge
Correct Answer:
Verified
View Answer
Unlock this answer now
Get Access to more Verified Answers free of charge
Q1: The % by weight of the element
Q2: The mean is the middle value of
Q3: An insurance agent is studying fire damage
Q4: The interquartile range is resistant to the
Q6: One disadvantage of using the mean as
Q7: A common topic of study among biologists
Q8: What is the potential drawback of usage
Q9: If there are no outliers, a skeletal
Q10: The % by weight of the element
Q11: Identify the correct formula for the value