Multiple Choice
Figure 7-1
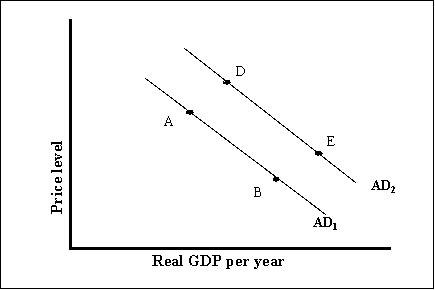
-Refer to Figure 7-1.What could have caused a movement from point C to point A?
A) an increase in the economy's general price level
B) a decrease in investment demand due to lower expected sales
C) a decrease in capital gains taxes
D) an increase in money supply that lowers interest rate
Correct Answer:

Verified
Correct Answer:
Verified
Q2: In a graph that shows the aggregate
Q7: During the recession of 2001, the leftward
Q11: All the following explain price stickiness except<br>A)firms
Q36: During the recession of 2001, despite the
Q56: Figure 7-2 <img src="https://d2lvgg3v3hfg70.cloudfront.net/TB5507/.jpg" alt="Figure 7-2
Q57: An increase in the prices of natural
Q73: Figure 7-2 <img src="https://d2lvgg3v3hfg70.cloudfront.net/TB5507/.jpg" alt="Figure 7-2
Q115: Figure 7-2 <img src="https://d2lvgg3v3hfg70.cloudfront.net/TB5507/.jpg" alt="Figure 7-2
Q129: The use central bank policies to influence
Q153: The short run in macroeconomic analysis is