Multiple Choice
Figure 13-1 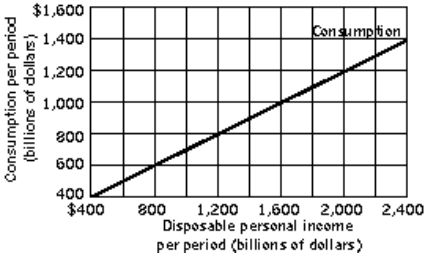
-Refer to Figure 13-1. The marginal propensity to consume is
A) 0.25.
B) 0.50.
C) 0.60.
D) 0.67.
Correct Answer:

Verified
Correct Answer:
Verified
Q3: Table 13-1<br> <img src="https://d2lvgg3v3hfg70.cloudfront.net/TB5507/.jpg" alt="Table 13-1
Q6: Difficulty: Medium Figure 13-4 <img src="https://d2lvgg3v3hfg70.cloudfront.net/TB5507/.jpg" alt="Difficulty:
Q7: Table 13-1<br> <img src="https://d2lvgg3v3hfg70.cloudfront.net/TB5507/.jpg" alt="Table 13-1
Q10: Using the aggregate expenditures model, which of
Q35: Suppose the consumption function is C =
Q65: If the economy spends 80% of any
Q66: In general, an increase in the income
Q113: Suppose at each price level, autonomous aggregate
Q148: The multiplier effect indicates that<br>A) the aggregate
Q153: The income households receive less the personal