Multiple Choice
Figure 13-3 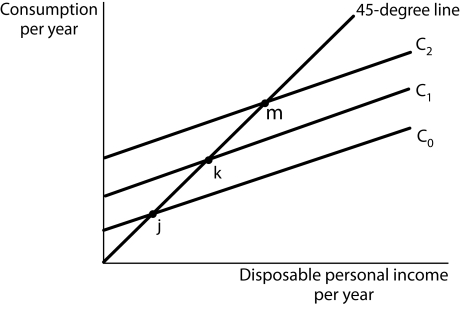
-Refer to Figure 13-3. Suppose the consumption function is given by curve C1. Which of the following will cause an upward shift to curve C2?
A) a decrease in wealth
B) an increase in price level
C) an increase in interest rates
D) an increase in consumer confidence
Correct Answer:

Verified
Correct Answer:
Verified
Q12: Personal saving is disposable personal income not
Q67: If an economy spends 90% of any
Q115: The wealth effect is the tendency for<br>A)
Q130: Unplanned investment is<br>A) the level of investment
Q181: Figure 13-6 <img src="https://d2lvgg3v3hfg70.cloudfront.net/TB5507/.jpg" alt="Figure 13-6
Q181: The saving function shows<br>A) the amount of
Q183: Unplanned investment occurs when <br>I. aggregate expenditures
Q188: If C = $400 billion + 0.75(Y<sub>d</sub>)
Q190: The consumption function shows the negative relationship
Q194: An increase in the wealth of households,