Multiple Choice
Figure 13-3 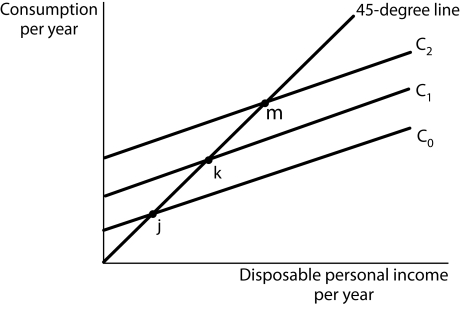
-Refer to Figure 13-3. Suppose the consumption function is given by curve C1. Which of the following will cause a downward shift to curve C1?
A) a stock market crash that decreases household wealth
B) a decrease in price level
C) an increase in withholding tax rate
D) rising optimism about economic conditions
Correct Answer:

Verified
Correct Answer:
Verified
Q28: The aggregate demand curve can be derived
Q45: In general, we expect that a reduction
Q88: If consumption increases by $75 billion when
Q89: Which of the following statements is true
Q90: Table 13-3<br>All figures in billions of base-year
Q90: In graph that shows disposable income on
Q91: Figure 13-6 <img src="https://d2lvgg3v3hfg70.cloudfront.net/TB5507/.jpg" alt="Figure 13-6
Q93: A decrease in the price level, all
Q97: Difficulty: Medium Figure 13-4 <img src="https://d2lvgg3v3hfg70.cloudfront.net/TB5507/.jpg" alt="Difficulty:
Q103: Suppose when disposable personal income increases from