Multiple Choice
Figure 16-7 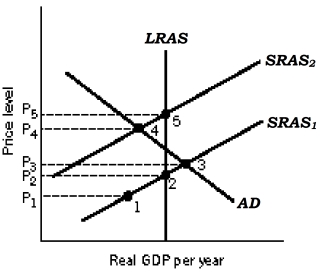
-Refer to Figure 16-7. Over time, the aggregate supply curve shifts from SRAS1 to SRAS2
Because of
A) rising output prices.
B) economic agents adjust their expectations regarding prices and wages downwards.
C) a fall in nominal wages.
D) economic agents adjust their expectations regarding prices and wages upwards.
Correct Answer:

Verified
Correct Answer:
Verified
Q12: The Phillips phase of the inflation-unemployment relationship
Q13: In the late 1970s, the U.S. economy
Q17: Suppose the full-employment level of real GDP
Q36: Prior to the 1970s, the model of
Q48: A period marked by rising unemployment and
Q60: Since 1979 when inflation soared into the
Q71: The Phillips phase of the inflation-unemployment relationship
Q74: In the equation of exchange, if velocity
Q80: The short-run Phillips curve implies a positive
Q128: Which of the following affect the values