Multiple Choice
The following figure illustrates the action of a HF and F buffer where the sizes of the boxes are proportional to the concentrations of HF and F in solution. According to this figure, what happens when H3O+ is added to the HF/F buffer? 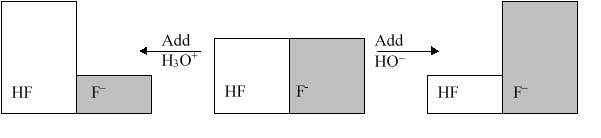
A) The pH decreases.
B) The pH increases.
C) The concentration of HF increases.
D) The concentration of F increases.
E) Nothing happens.
Correct Answer:

Verified
Correct Answer:
Verified
Q19: Water can react as both an acid
Q57: Which of the following types of molecules
Q61: Each circle is a sample of an
Q62: The neutralization reaction of potassium hydrogen carbonate
Q64: When a base is dissolved in water,
Q65: Which of the following statements best describes
Q67: Which of the following conditions could cause
Q69: In the acid-base reaction between ammonia and
Q70: What is the pH of a solution
Q71: Which of the following acids is not