Multiple Choice
According to the graph below, which of the following is TRUE? 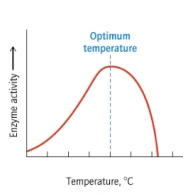
A) At high temperature, the activity of the enzyme decreases more sharply than it does at low temperature.
B) At low temperature, the activity of the enzyme decreases more sharply than it does at high temperature.
C) The maximum activity is at the lowest temperature.
D) The maximum activity is at the highest temperature.
E) The activity of the enzyme is the same at all temperatures.
Correct Answer:

Verified
Correct Answer:
Verified
Q33: How many naturally occurring amino acids are
Q77: Which of the amino acids in the
Q78: Physiological pH is a pH of approximately<br>A)
Q79: Which side chain would most likely be
Q80: Which of the following correctly shows the
Q83: How is the following amino acid classified?
Q84: The carbon with a smiley face over
Q85: Assuming that the enzyme represented by the
Q86: Which of the following statements best describes
Q119: Is Gly-Ala-His the same tripeptide as His-Ala-Gly?<br>A)