Multiple Choice
Table 7-14 
-Refer to Table 7-14. You want to hire a professional photographer to take pictures of your family. The table shows the costs of the four potential sellers in the local photography market. Which of the following graphs represents the market supply curve?
A) 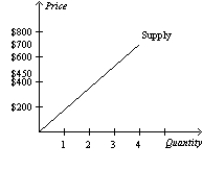
B) 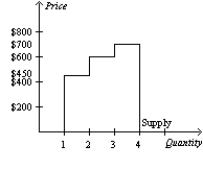
C) 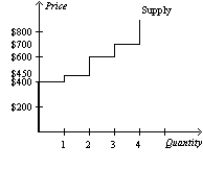
D) 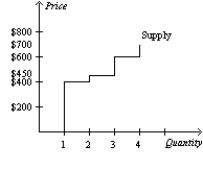
Correct Answer:

Verified
Correct Answer:
Verified
Q2: Which of the Ten Principles of Economics
Q10: Figure 7-19 <img src="https://d2lvgg3v3hfg70.cloudfront.net/TB2297/.jpg" alt="Figure 7-19
Q14: Figure 7-6 <img src="https://d2lvgg3v3hfg70.cloudfront.net/TB2297/.jpg" alt="Figure 7-6
Q30: Figure 7-34 <img src="https://d2lvgg3v3hfg70.cloudfront.net/TB2297/.jpg" alt="Figure 7-34
Q34: Figure 7-10 <img src="https://d2lvgg3v3hfg70.cloudfront.net/TB2297/.jpg" alt="Figure 7-10
Q95: Figure 7-3 <img src="https://d2lvgg3v3hfg70.cloudfront.net/TB2297/.jpg" alt="Figure 7-3
Q468: Table 7-3<br>The only four consumers in a
Q470: Table 7-1 <img src="https://d2lvgg3v3hfg70.cloudfront.net/TB1273/.jpg" alt="Table 7-1
Q471: Table 7-10<br>The following table represents the costs
Q477: Which of the following is not equal