Multiple Choice
Table 7-7 
-Refer to Table 7-7. You are selling extra tickets to the Midwest Regional Sweet 16 game in the men's NCAA basketball tournament. The table shows the willingness to pay of the four potential buyers in the market for a ticket to the game. Which of the following graphs represents the market demand curve?
A) 
B) 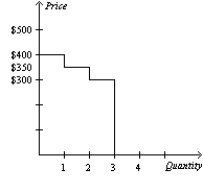
C) 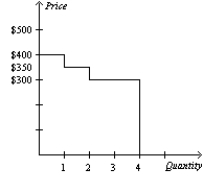
D) 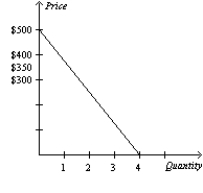
Correct Answer:

Verified
Correct Answer:
Verified
Q8: Suppose Katie,Kendra,and Kristen each purchase a particular
Q11: Total surplus in a market will increase
Q21: Which of the following is correct?<br>A)Efficiency deals
Q37: Figure 7-33 <img src="https://d2lvgg3v3hfg70.cloudfront.net/TB2297/.jpg" alt="Figure 7-33
Q40: Figure 7-34 <img src="https://d2lvgg3v3hfg70.cloudfront.net/TB2297/.jpg" alt="Figure 7-34
Q48: Producer surplus equals<br>A)Value to buyers - Amount
Q55: PlayStations and PlayStation games are complementary goods.A
Q83: If a consumer is willing and able
Q197: The equilibrium of supply and demand in
Q333: Table 7-7 <img src="https://d2lvgg3v3hfg70.cloudfront.net/TB1273/.jpg" alt="Table 7-7