Essay
Tammy loves donuts. The table shown reflects the value Tammy places on each donut she eats: 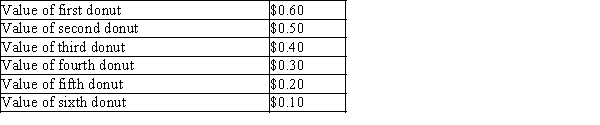
a.Use this information to construct Tammy's demand curve for donuts.
b.If the price of donuts is $0.20, how many donuts will Tammy buy?
c.Show Tammy's consumer surplus on your graph. How much consumer surplus would she have at a price of $0.20?
d.If the price of donuts rose to $0.40, how many donuts would she purchase now? What would happen to Tammy's consumer surplus? Show this change on your graph.
Correct Answer:

Verified
a.  b.At a price of $0.20, Tammy would b...
View Answer
Unlock this answer now
Get Access to more Verified Answers free of charge
Correct Answer:
Verified
View Answer
Unlock this answer now
Get Access to more Verified Answers free of charge
Q2: Figure 7-4 <img src="https://d2lvgg3v3hfg70.cloudfront.net/TB2297/.jpg" alt="Figure 7-4
Q26: On a graph,the area below a demand
Q26: If Darby values a soccer ball at
Q40: Efficiency is related to the size of
Q52: Chad is willing to pay $5.00 to
Q104: Figure 7-23 <img src="https://d2lvgg3v3hfg70.cloudfront.net/TB2297/.jpg" alt="Figure 7-23
Q120: Figure 7-22 <img src="https://d2lvgg3v3hfg70.cloudfront.net/TB2297/.jpg" alt="Figure 7-22
Q390: Market failure is the inability of<br>A)buyers to
Q392: Table 7-7 <img src="https://d2lvgg3v3hfg70.cloudfront.net/TB1273/.jpg" alt="Table 7-7
Q395: Table 7-5<br>For each of three potential buyers