Multiple Choice
Table 5-7
The following table shows a portion of the demand schedule for a particular good at various levels of income. 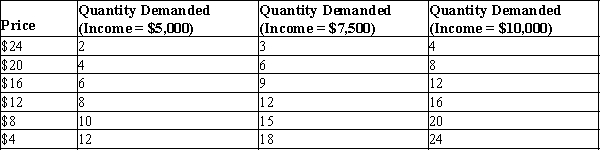
-Refer to Table 5-7. Using the midpoint method, when income equals $5,000, what is the price elasticity of demand between $8 and $12?
A) 0.56
B) 0.75
C) 1.33
D) 1.80
Correct Answer:

Verified
Correct Answer:
Verified
Q26: Suppose researchers at the University of Wisconsin
Q45: When a supply curve is relatively flat,the<br>A)sellers
Q67: Table 5-5<br><br><br> <span class="ql-formula" data-value="\begin{array}
Q99: Suppose the point (Q = 3,400,P =
Q113: Tyler purchases 5 pounds of hot dogs
Q175: When the price of good A is
Q222: Elasticity of demand is closely related to
Q223: An increase in price causes an increase
Q290: When the price of a bracelet was
Q332: Table 5-5 <img src="https://d2lvgg3v3hfg70.cloudfront.net/TB1273/.jpg" alt="Table 5-5