Multiple Choice
Figure 21-29
The figure below illustrates the preferences of a representative consumer, Nathaniel. 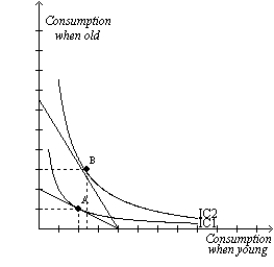
-Refer to Figure 21-29. Interest rates increase by 4 percent. Nathaniel's optimal choice point moves from A to B. Nathaniel consumes
A) less while he is younger and saves more than he did before interest rates increased.
B) more while he is younger and saves more than he did before interest rates increased.
C) less while he is younger and saves less than he did before interest rates increased.
D) more while he is younger and saves less than he did before interest rates increased.
Correct Answer:

Verified
Correct Answer:
Verified
Q184: A consumer is currently spending all of
Q207: If a consumer purchases more of good
Q256: Irrespective of whether she is at her
Q257: Figure 21-25 The figure pertains to a
Q258: Traci consumes two goods, lemonade and pretzels.
Q260: Figure 21-6 <img src="https://d2lvgg3v3hfg70.cloudfront.net/TB1273/.jpg" alt="Figure 21-6
Q262: Suppose a consumer has preferences over two
Q263: The rate at which a consumer is
Q265: Jack and Diane each buy pizza and
Q266: Calvin is planning ahead for retirement and