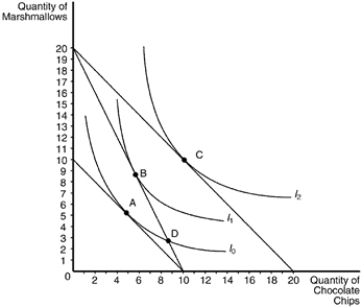
Figure 21-20 The Following Graph Illustrates a Representative Consumer's Preferences for Marshmallows
Multiple Choice
Figure 21-20
The following graph illustrates a representative consumer's preferences for marshmallows and chocolate chip cookies: 
-Refer to Figure 21-20. Assume that the consumer has an income of $100 and currently optimizes at bundle A. When the price of marshmallows decreases to $5, which bundle will the optimizing consumer choose?
A) A
B) B
C) C
D) D
Correct Answer:

Verified
Correct Answer:
Verified
Q36: Suppose that you have $100 today and
Q123: Teresa faces prices of $6.00 for a
Q227: An individual's demand curve for a good
Q229: The substitution effect of a price change
Q230: Economic theory predicts that an increase in
Q231: In the upward-sloping portion of the individual
Q233: Suppose Raul has budgeted $100 of his
Q235: Figure 21-24 The figure shows three indifference
Q236: Suppose a consumer has an income of
Q237: A Giffen good is a good for