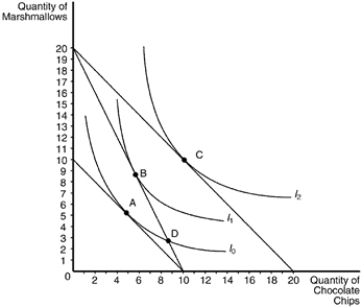
Figure 21-20 The Following Graph Illustrates a Representative Consumer's Preferences for Marshmallows
Multiple Choice
Figure 21-20
The following graph illustrates a representative consumer's preferences for marshmallows and chocolate chip cookies: 
-Refer to Figure 21-20. Assume that the consumer has an income of $40. If the price of chocolate chips is $4 and the price of marshmallows is $4, the optimizing consumer would choose to purchase
A) 9 marshmallows and 6 chocolate chips.
B) 10 marshmallows and 10 chocolate chips.
C) 5 marshmallows and 5 chocolate chips.
D) 3 marshmallows and 9 chocolate chips.
Correct Answer:

Verified
Correct Answer:
Verified
Q123: Teresa faces prices of $6.00 for a
Q125: The substitution effect of a price change
Q221: Figure 21-24 The figure shows three indifference
Q222: The theory of consumer choice examines how<br>A)firms
Q223: If an indifference curve is bowed in
Q225: Both Diana and Sarah like jazz music
Q227: An individual's demand curve for a good
Q229: The substitution effect of a price change
Q230: Economic theory predicts that an increase in
Q231: In the upward-sloping portion of the individual