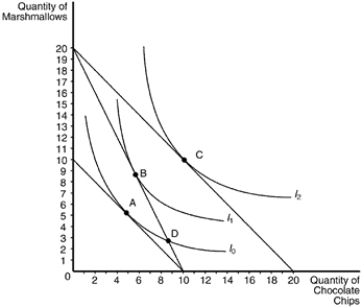
Figure 21-20 The Following Graph Illustrates a Representative Consumer's Preferences for Marshmallows
Multiple Choice
Figure 21-20
The following graph illustrates a representative consumer's preferences for marshmallows and chocolate chip cookies: 
-Refer to Figure 21-20. Assume that the consumer has an income of $40. Based on the information available in the graph, which of the following price-quantity combinations would be on her demand curve for marshmallows if the price of chocolate chips were $4?
A) P=$2, Q=3
B) P=$2, Q=9
C) P=$4, Q=3
D) P=$4, Q=9
Correct Answer:

Verified
Correct Answer:
Verified
Q14: The indifference curves for nickels and dimes
Q17: Using indifference curves and budget constraints, graphically
Q55: Scenario 21-3<br>Scott knows that he will ultimately
Q57: When two goods are perfect substitutes, the<br>A)indifference
Q58: The income effect of an increase in
Q60: When the price of a normal good
Q61: Figure 21-3<br>In each case, the budget constraint
Q62: If an indifference curve is bowed out
Q78: What is significant about a point on
Q177: What does the slope of a budget