Multiple Choice
Figure 21-24 The figure shows three indifference curves and a budget constraint for a certain consumer named Steve. 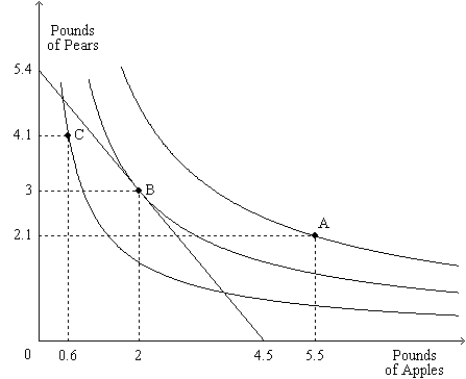
-Refer to Figure 21-24. About what percentage of his income is Steve spending on apples when he is at his optimum?
A) 33.3 percent
B) 38.2 percent
C) 44.4 percent
D) 56.7 percent
Correct Answer:

Verified
Correct Answer:
Verified
Q117: When a consumer experiences a price increase
Q118: Irene is a vegetarian, so she does
Q119: Good X is a Giffen good. When
Q120: Suppose that you have $100 today and
Q121: Figure 21-19 <img src="https://d2lvgg3v3hfg70.cloudfront.net/TB1273/.jpg" alt="Figure 21-19
Q123: A good is an inferior good if
Q124: If the relative price of a concert
Q125: Suppose Caroline will only drink a cup
Q126: Hannah and Chris each like jewelry and
Q127: Suppose good X is on the horizontal