Multiple Choice
Figure 21-11 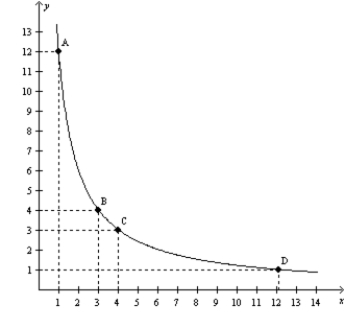
-Refer to Figure 21-11. The graph illustrates
A) a typical budget constraint.
B) a typical indifference curve.
C) an indifference curve where goods X and Y are perfect complements.
D) an indifference curve where goods X and Y are perfect substitutes.
Correct Answer:

Verified
Correct Answer:
Verified
Q61: All points on a demand curve are
Q161: A Giffen good is a good for
Q163: Figure 21-24 The figure shows three indifference
Q164: For Molly, the substitution effect of a
Q165: Figure 21-18 <img src="https://d2lvgg3v3hfg70.cloudfront.net/TB1273/.jpg" alt="Figure 21-18
Q167: Figure 21-9 <img src="https://d2lvgg3v3hfg70.cloudfront.net/TB1273/.jpg" alt="Figure 21-9
Q168: Ryan experiences an increase in his wages.
Q169: The labor supply curve may have a
Q170: When two goods are perfect complements, the
Q171: Figure 21-11 <img src="https://d2lvgg3v3hfg70.cloudfront.net/TB1273/.jpg" alt="Figure 21-11