Multiple Choice
Figure 21-14 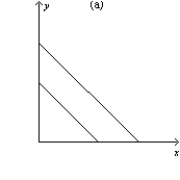
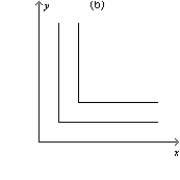
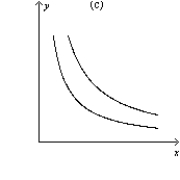
-Refer to Figure 21-14. Which of the graphs shown represent indifference curves for perfect complements?
A) graph a
B) graph b
C) graph c
D) All of the above are correct.
Correct Answer:

Verified
Correct Answer:
Verified
Q114: "Left" gloves and "right" gloves provide a
Q402: Figure 21-18 <img src="https://d2lvgg3v3hfg70.cloudfront.net/TB1273/.jpg" alt="Figure 21-18
Q403: Figure 21-7 <img src="https://d2lvgg3v3hfg70.cloudfront.net/TB1273/.jpg" alt="Figure 21-7
Q404: Bundle L contains 10 units of good
Q405: A good is an inferior good if
Q406: Figure 21-32 The figure shows three indifference
Q408: If we observe that Jamie's budget constraint
Q409: Higher indifference curves are preferred to lower
Q410: The bowed shape of the indifference curve
Q411: Figure 21-22 <img src="https://d2lvgg3v3hfg70.cloudfront.net/TB1273/.jpg" alt="Figure 21-22