Multiple Choice
Figure 21-14 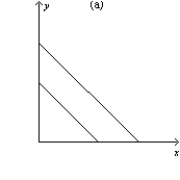
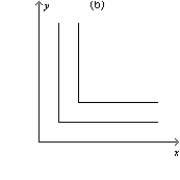
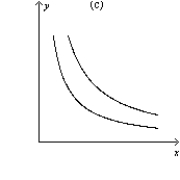
-Refer to Figure 21-14. Which of the graphs shown represent indifference curves for perfect substitutes?
A) graph a
B) graph b
C) graph c
D) All of the above are correct.
Correct Answer:

Verified
Correct Answer:
Verified
Q479: Higher education is a normal good. If
Q480: Scenario 21-2<br>Lawrence has recently graduated from college
Q481: Suppose the price of good X falls.
Q482: Two economists found empirical evidence that when
Q483: The marginal rate of substitution is equal
Q485: The opportunity cost of current household consumption
Q486: Figure 21-14 <img src="https://d2lvgg3v3hfg70.cloudfront.net/TB1273/.jpg" alt="Figure 21-14
Q487: A consumer chooses an optimal consumption point
Q488: Figure 21-14 <img src="https://d2lvgg3v3hfg70.cloudfront.net/TB1273/.jpg" alt="Figure 21-14
Q489: Figure 21-13 <img src="https://d2lvgg3v3hfg70.cloudfront.net/TB1273/.jpg" alt="Figure 21-13