Multiple Choice
Figure 21-14 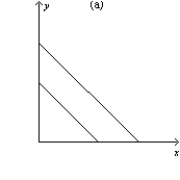
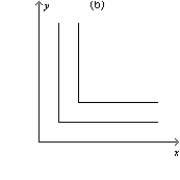
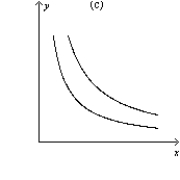
-Refer to Figure 21-14. Which of the graphs illustrates indifference curves for which the marginal rate of substitution is undefined?
A) graph a
B) graph b
C) graph c
D) All of the above are correct.
Correct Answer:

Verified
Correct Answer:
Verified
Related Questions
Q494: A consumer's preferences for right shoes and
Q495: Which of the following equations corresponds to
Q496: Figure 21-2 The downward-sloping line on the
Q497: Karen, Tara, and Chelsea each buy ice
Q498: Scenario 21-4 Frank spends all of his
Q500: Figure 21-25 The figure pertains to a
Q501: Figure 21-24 The figure shows three indifference
Q502: Figure 21-1 The downward-sloping line on the
Q503: When Jamar has an income of $2,000,
Q504: When leisure is a normal good, the