Multiple Choice
Figure 21-15 On the graph, Qx represents the quantity of good x and Qy represents the quantity of good y. The lines drawn on the graph represent three of Barbara's indifference curves. 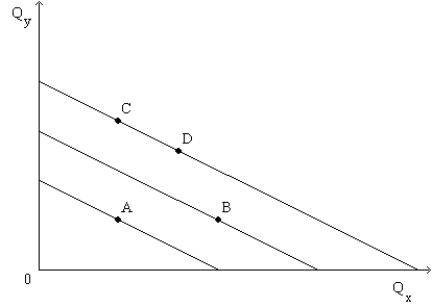
-Refer to Figure 21-15. For Barbara, goods x and y are
A) imperfect complements.
B) imperfect substitutes.
C) perfect substitutes.
D) perfect complements.
Correct Answer:

Verified
Correct Answer:
Verified
Q113: Consumer will always consume more of a
Q124: The indifference curves for perfect substitutes are
Q353: An increase in a consumer's income<br>A)increases the
Q354: Figure 21-12 <img src="https://d2lvgg3v3hfg70.cloudfront.net/TB1273/.jpg" alt="Figure 21-12
Q355: Indifference curves that cross violate the property
Q356: The consumer's optimal choice is the one
Q360: Figure 21-2 The downward-sloping line on the
Q361: A budget constraint shows<br>A)the maximum utility that
Q362: Figure 21-13 <img src="https://d2lvgg3v3hfg70.cloudfront.net/TB1273/.jpg" alt="Figure 21-13
Q363: Figure 21-19 <img src="https://d2lvgg3v3hfg70.cloudfront.net/TB1273/.jpg" alt="Figure 21-19