Multiple Choice
Figure 21-15 On the graph, Qx represents the quantity of good x and Qy represents the quantity of good y. The lines drawn on the graph represent three of Barbara's indifference curves. 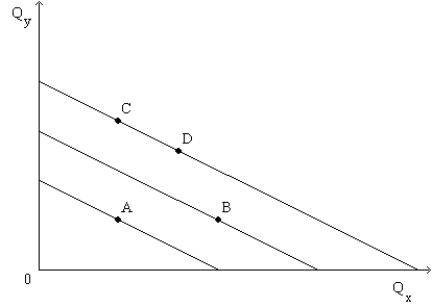
-Refer to Figure 21-15. Barbara is happier at
A) point B than at point A.
B) point B than at point C.
C) point C than at point D.
D) All of the above are correct.
Correct Answer:

Verified
Correct Answer:
Verified
Q10: Consider the indifference curve map and budget
Q29: Economists have found evidence of a Giffen
Q118: A consumer's budget constraint is drawn on
Q125: Suppose Caroline will only drink a cup
Q126: Hannah and Chris each like jewelry and
Q127: Suppose good X is on the horizontal
Q131: Andi uses all of her income to
Q132: Scenario 21-2<br>Lawrence has recently graduated from college
Q133: Figure 21-28<br>The figure below illustrates the preferences
Q200: The slope of the budget constraint reveals