Multiple Choice
Figure 21-4
In each case, the budget constraint moves from BC-1 to BC-2. 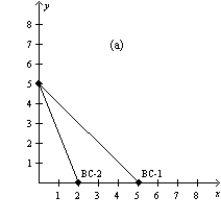
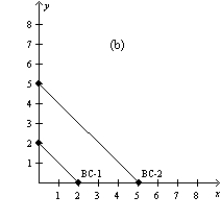
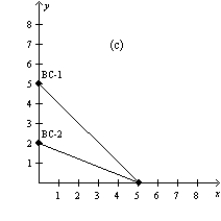
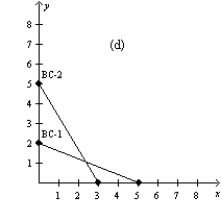
-Refer to Figure 21-4. Which of the graphs in the figure could reflect a decrease in income?
A) graph a
B) graph b
C) graph d
D) None of the above is correct.
Correct Answer:

Verified
Correct Answer:
Verified
Q8: Suppose that you have $100 today and
Q9: Figure 21-24 The figure shows three indifference
Q10: Figure 21-6 <img src="https://d2lvgg3v3hfg70.cloudfront.net/TB1273/.jpg" alt="Figure 21-6
Q11: Consider a consumer who purchases two goods,
Q12: Indifference curves tend to be bowed inward
Q14: Figure 21-17 <img src="https://d2lvgg3v3hfg70.cloudfront.net/TB1273/.jpg" alt="Figure 21-17
Q16: Figure 21-24 The figure shows three indifference
Q17: Figure 21-2 The downward-sloping line on the
Q18: Which of the following is a property
Q122: For Antonio, the income effect of an