Essay
Figure 21-30 The graph shows two budget constraints for a consumer. 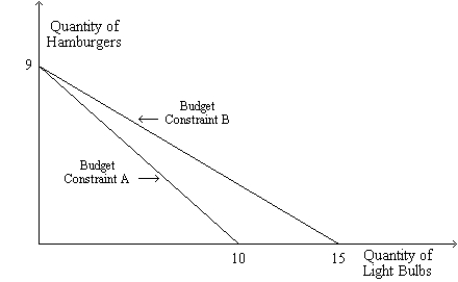
-Refer to Figure 21-30. Suppose the price of a light bulb is $3 and Budget Constraint B applies. What is the consumer's income? What is the price of a hamburger?
Correct Answer:

Verified
The consumer's incom...View Answer
Unlock this answer now
Get Access to more Verified Answers free of charge
Correct Answer:
Verified
View Answer
Unlock this answer now
Get Access to more Verified Answers free of charge
Q139: An optimizing consumer will select the consumption
Q141: If we observe that a consumer's budget
Q142: Figure 21-6 <img src="https://d2lvgg3v3hfg70.cloudfront.net/TB1273/.jpg" alt="Figure 21-6
Q143: Assume that a college student purchases only
Q145: A consumer likes two goods: books and
Q146: The marginal rate of substitution<br>A)varies along an
Q147: The marginal rate of substitution between two
Q149: The income effect of a price change
Q180: Evaluate the following statement, "Warren Buffet is
Q181: A rise in the interest rate will