Multiple Choice
Table 20-9
Income Inequality in the United States
The values in the table reflect the percentages of pre-tax-and transfer income. 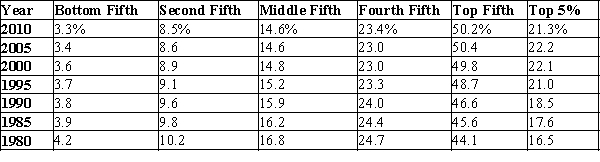 Source: US Census Bureau
-Refer to Table 20-9. In 2010, the top fifth of the US population had
A) 50.2% more income than the remainder of the population.
B) a lower share of income than the top fifth in 1980.
C) about 15 times as much income as the bottom fifth.
D) about 6 times as much income as the middle fifth.
Correct Answer:

Verified
Correct Answer:
Verified
Q77: Fewer than three percent of families are
Q106: When designing public policies, which income group
Q114: The poverty rate is the percentage of
Q152: A goal of libertarians is to provide
Q252: The poverty rate for female households with
Q253: The poverty rate is<br>A)a measure of income
Q254: Table 20-13<br>The following table shows the distribution
Q255: Figure 20-3 <img src="https://d2lvgg3v3hfg70.cloudfront.net/TB1273/.jpg" alt="Figure 20-3
Q259: Table 20-5<br>Distribution of Income in Umakastan <img
Q261: The political philosophy that views the redistribution