Multiple Choice
Figure 20-1
Number of Poor 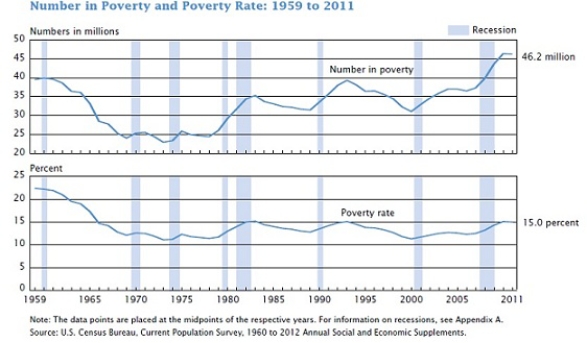
-Refer to Figure 20-1. Between 1965 and 2011, during recessions (the shaded bars) the number of individuals in poverty has
A) increased.
B) decreased.
C) not changed.
D) decreased and then increased.
Correct Answer:

Verified
Correct Answer:
Verified
Q34: Suppose the government used the following formula
Q444: Table 20-13<br>The following table shows the distribution
Q445: In the United States, long-term poverty affects<br>A)more
Q446: Scenario 20-2<br>The government is proposing switching from
Q447: Table 20-11<br>Poverty Thresholds in 2011, by Size
Q448: Governments enact policies to<br>A)make the distribution of
Q450: Which of the following statements accurately characterizes
Q451: The poverty line is<br>A)established by the federal
Q452: Scenario 20-7<br>Zooey is a single mother of
Q453: Table 20-10 <img src="https://d2lvgg3v3hfg70.cloudfront.net/TB1273/.jpg" alt="Table 20-10