Multiple Choice
Figure 20-3 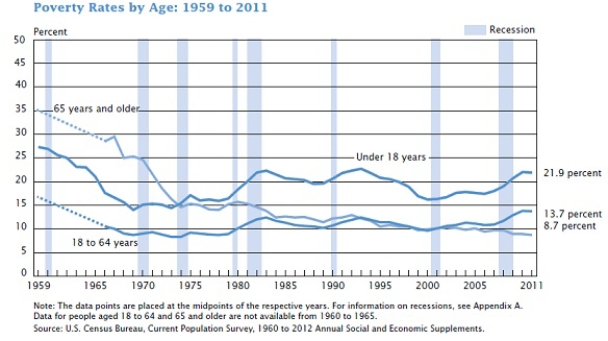
-Refer to Figure 20-3. Which of the following best describes the poverty rates by age from 1965 to 2011?
A) The poverty rates by age have declined for all age groups.
B) The percentage of people living in poverty has consistently been highest for the elderly aged 65 and over and lowest for adults aged 18 to 64.
C) The percentage of children under age 18 and the percentage of adults aged 18 to 64 have maintained a similar trend while the percentage of elderly aged 65 and over has decreased significantly.
D) The poverty rates by age have increased for all age groups.
Correct Answer:

Verified
Correct Answer:
Verified
Q83: An income distribution may not give an
Q90: There is very little economic mobility in
Q127: In 2011 the top 20% of income
Q147: Jermaine believes that it is important to
Q170: The poverty line is set by the
Q188: A government's policy of redistributing income makes
Q334: Liberalism is the political philosophy espoused by<br>A)Robert
Q337: Which of the following programs to alleviate
Q342: The only qualification to receive government assistance
Q343: If income were equally distributed among households,<br>A)each