Multiple Choice
Figure 19-1 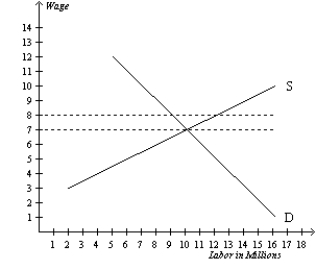
-Refer to Figure 19-1. Suppose the local labor market was in equilibrium to begin with but then the largest local employer decided to change its compensation scheme to $8 as shown. Which of the following compensation schemes could the graph be illustrating?
A) An efficiency wage.
B) Discrimination.
C) A compensating differential.
D) The superstar phenomenon.
Correct Answer:

Verified
Correct Answer:
Verified
Q480: Studies of professional sports teams suggest that,
Q481: According to the superstar phenomenon, the most
Q482: Scenario 19-6<br>Suppose that in the competitive market
Q483: Which of the following explains the "beauty
Q484: Which of the following comparisons best illustrates
Q486: As a result of their experiment economists
Q487: Al and Steve are both reporters at
Q488: Difference in wages can be explained by
Q489: White women earn an average of 25%
Q490: The statement that "night shift workers make