Multiple Choice
Figure 18-7 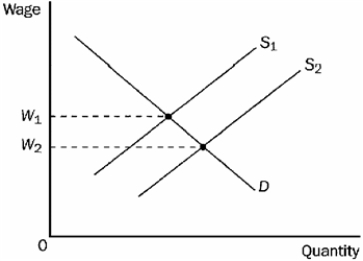
-Refer to Figure 18-7. If the relevant labor supply curve is S2 and the current wage is W1,
A) there is a surplus of labor.
B) the quantity of labor demanded exceeds the quantity of labor supplied.
C) an increase in the minimum wage could restore equilibrium in the market.
D) firms will need to raise the wage to restore equilibrium.
Correct Answer:

Verified
Correct Answer:
Verified
Q22: A profit-maximizing competitive firm will hire workers
Q63: Consider the labor market for computer programmers.
Q155: The equilibrium purchase price of an acre
Q176: When labor supply increases,<br>A)the marginal productivity of
Q541: Because workers in the U.S. economy receive
Q542: Figure 18-4<br>The graph below illustrates the market
Q544: Figure 18-1. The figure shows the relationship
Q548: Table 18-2 <img src="https://d2lvgg3v3hfg70.cloudfront.net/TB1273/.jpg" alt="Table 18-2
Q549: Figure 18-1<br>On the graph, L represents the
Q550: Figure 18-9 <img src="https://d2lvgg3v3hfg70.cloudfront.net/TB1273/.jpg" alt="Figure 18-9