Multiple Choice
Figure 18-8
This figure below shows the labor market for automobile workers. The curve labeled S is the labor supply curve, and the curves labeled D1 and D2 are the labor demand curves. On the horizontal axis, L represents the quantity of labor in the market. 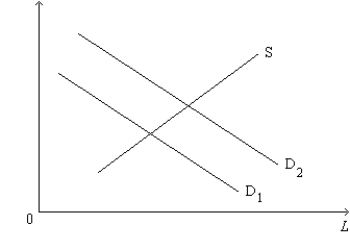
-Refer to Figure 18-8. Which of the following events would most likely explain a shift of the labor-demand curve from D2 back to D1?
A) The price of automobiles decreased.
B) A large number of immigrants entered the automobile-worker market.
C) A technological advance increased the marginal product of automobile workers.
D) The demand for automobiles increased.
Correct Answer:

Verified
Correct Answer:
Verified
Q50: The demand curve for capital<br>A)is vertical.<br>B)is horizontal.<br>C)is
Q53: The value of the marginal product of
Q80: To say that a firm is competitive
Q81: A consultant interviews the hiring manager of
Q82: Scenario 18-2<br>Gertrude Kelp owns three boats that
Q84: A competitive, profit-maximizing firm hires workers up
Q86: Figure 18-10 <img src="https://d2lvgg3v3hfg70.cloudfront.net/TB1273/.jpg" alt="Figure 18-10
Q87: Figure 18-9 <img src="https://d2lvgg3v3hfg70.cloudfront.net/TB1273/.jpg" alt="Figure 18-9
Q88: The marginal product of any factor of
Q90: Figure 18-5<br>The figure shows a particular profit-maximizing,