Multiple Choice
Figure 18-10 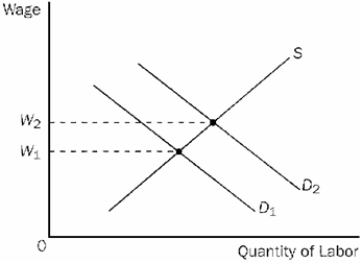
-Refer to Figure 18-10. If the relevant labor demand curve is D2 and the current wage is W1,
A) there is a surplus of labor.
B) there is a shortage of labor.
C) the quantity of labor supplied exceeds the quantity of labor demanded.
D) workers are failing to take into account the work-leisure tradeoff in deciding what quantity of labor to supply at alternative wages.
Correct Answer:

Verified
Correct Answer:
Verified
Q111: The idea that rational employers think at
Q223: Does an upward-sloping labor-supply curve mean that
Q459: Suppose that the market for labor is
Q460: Table 18-3 <img src="https://d2lvgg3v3hfg70.cloudfront.net/TB1273/.jpg" alt="Table 18-3
Q461: Who receives income from capital in the
Q462: Figure 18-6 <img src="https://d2lvgg3v3hfg70.cloudfront.net/TB1273/.jpg" alt="Figure 18-6
Q466: Figure 18-1<br>On the graph, L represents the
Q467: Figure 18-1<br>On the graph, L represents the
Q468: Dan owns one of the many bakeries
Q469: If Ernie's individual labor supply curve is