Multiple Choice
Figure 16-11 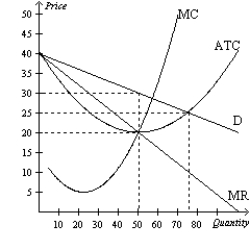
-Refer to Figure 16-11. The graph depicts a monopolistically competitive firm in the short run. Which of the following explanations best describes the long run adjustment?
A) More firms will enter this market and each firm will have a smaller share of the total market demand, shifting this firm's demand curve to the left.
B) More firms will enter this market and each firm will have a larger share of the total market demand, shifting this firm's demand to the right.
C) Firms will exit this market and each firm will have a smaller share of the total market demand, shifting this firm's demand to the left.
D) Firms will exit this market and each firm will have a larger share of the total market demand, shifting this firm's demand to the right.
Correct Answer:

Verified
Correct Answer:
Verified
Q227: Figure 16-13 <img src="https://d2lvgg3v3hfg70.cloudfront.net/TB1273/.jpg" alt="Figure 16-13
Q508: Of the following market structures, which are
Q509: Scenario 16-9<br>Dean goes to the grocery store
Q510: In the short run, a firm operating
Q511: Scenario 16-6<br>Ike's Ice Cream has decided to
Q512: Figure 16-8<br>The lines in the figures below
Q514: Scenario 16-2<br>Suppose market demand for a product
Q515: In some countries, brand name fast-food restaurants
Q516: Monopolistic competition is characterized by i)<br>Efficient scale<br>Ii)<br>Markup
Q517: Figure 16-11 <img src="https://d2lvgg3v3hfg70.cloudfront.net/TB1273/.jpg" alt="Figure 16-11