Multiple Choice
Table 16-1
The following table shows the percentage of output supplied by the top eight firms in four different industries. 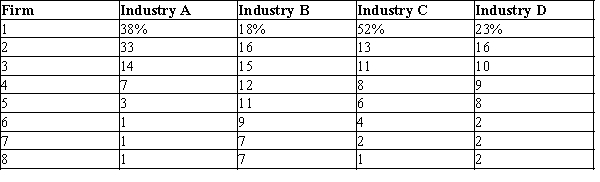
-Refer to Table 16-1. What is the concentration ratio in Industry B?
A) 18%
B) 34%
C) 61%
D) 95%
Correct Answer:

Verified
Correct Answer:
Verified
Q21: The product-variety externality is associated with the<br>A)producer
Q233: Figure 16-14 <img src="https://d2lvgg3v3hfg70.cloudfront.net/TB1273/.jpg" alt="Figure 16-14
Q298: Scenario 16-3<br>Peter operates an ice cream shop
Q299: Figure 16-10<br>The figure is drawn for a
Q300: In which of the following market structures
Q302: Figure 16-2. The figure is drawn for
Q304: The debate over the efficiency of markets
Q306: Figure 16-12 <img src="https://d2lvgg3v3hfg70.cloudfront.net/TB1273/.jpg" alt="Figure 16-12
Q307: Advertisements that appear to convey no information
Q308: Which of the following statements is not