Multiple Choice
Figure 16-1 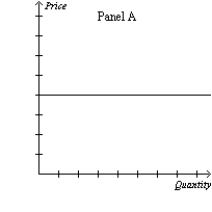
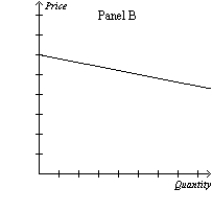
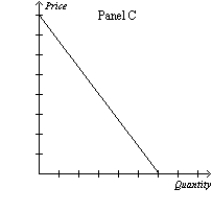
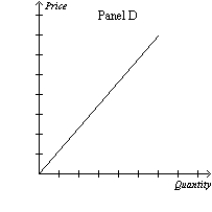
-Refer to Figure 16-1. Which of the graphs illustrates the demand curve most likely faced by a firm in a monopolistically competitive market?
A) Panel A
B) Panel B
C) Panel C
D) Panel D
Correct Answer:

Verified
Correct Answer:
Verified
Q43: Scenario 16-9<br>Dean goes to the grocery store
Q53: Figure 16-3 <img src="https://d2lvgg3v3hfg70.cloudfront.net/TB7555/.jpg" alt="Figure 16-3
Q62: Discuss how brand names may enhance the
Q71: Defenders of advertising argue that firms use
Q199: In a monopolistically competitive market, the number
Q220: Considering perfect competition, monopolistic competition, and monopoly,
Q341: Entry by new firms into a monopolistically
Q346: Which of the following conditions is characteristic
Q348: Figure 16-6 <img src="https://d2lvgg3v3hfg70.cloudfront.net/TB1273/.jpg" alt="Figure 16-6
Q349: An oligopoly<br>A)has a concentration ratio of less