Multiple Choice
Figure 16-1 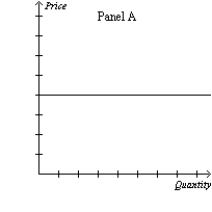
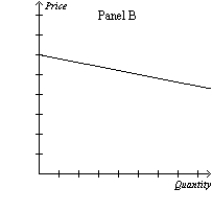
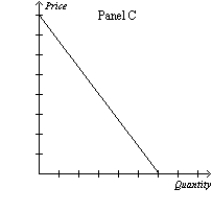
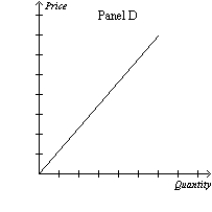
-Refer to Figure 16-1. Which of the following sets of explanations best describes the differences between the graphs above?
A) Panel A: monopolistically competitive firm's demand curve Panel B: monopoly firm's demand curve
Panel C: oligopoly firm's demand curve
Panel D: perfectly competitive firm's demand curve
B) Panel A: oligopoly firm's demand curve Panel B: perfectly competitive firm's demand curve
Panel C: monopolistically competitive firm's demand curve
Panel D: supply curve
C) Panel A: perfectly competitive firm's demand curve Panel B: monopolistically competitive firm's demand curve
Panel C: monopoly firm's demand curve
Panel D: supply curve
D) Panel A: monopolistically competitive firm's demand curve Panel B: monopoly firm's demand curve
Panel C: perfectly competitive firm's demand curve
Panel D: supply curve
Correct Answer:

Verified
Correct Answer:
Verified
Q51: A firm in a monopolistically competitive market
Q129: Economists measure a market's domination by a
Q147: Scenario 16-7<br>Consider the problem facing two firms,
Q148: Which of the following statements is correct?<br>A)In
Q153: It has been said that many of
Q154: Figure 16-4 <img src="https://d2lvgg3v3hfg70.cloudfront.net/TB1273/.jpg" alt="Figure 16-4
Q155: Television advertisements aired during major sporting events
Q156: Which of the following goods are likely
Q157: Which of the following conditions is characteristic
Q465: Scenario 16-8<br>Burger Bonanza, a major national burger